Trang phanductaibvnd115.blogspot.com là một trang blog cá nhân được lập ra mục đích chia sẻ thông tin chuyên ngành lĩnh vực nội khoa, hồi sưc cấp cứu, tim mạch
Translate
Saturday, March 9, 2024
Wellens Syndrome
Wellens Syndrome is a clinical syndrome characterised by biphasic or deeply inverted T waves in V2-3, plus a history of recent chest pain now resolved. It is highly specific for critical stenosis of the left anterior descending artery (LAD)
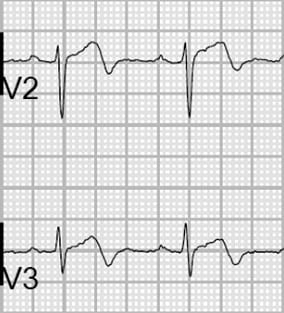
Wellens pattern A: Biphasic T waves
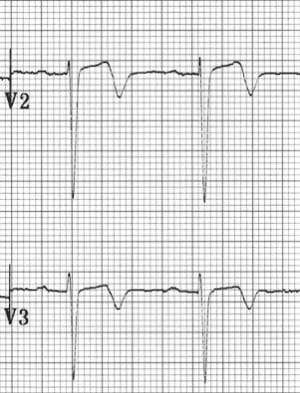
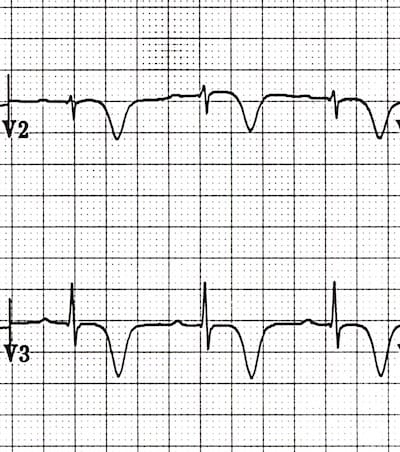
Wellens pattern B: Deeply inverted T waves
The pattern is usually present in the pain free state — it may be obscured during episodes of ischaemic chest pain, when there is “pseudonormalisation” of T waves in V2-3
Wellens syndrome is a key example of why all patients presenting with chest pain must have serial ECGs
Clinical significance
Patients may be pain free by the time the ECG is taken, and have normal or minimally elevated cardiac enzymes. However, they are at extremely high risk for extensive anterior wall MI within the subsequent days to weeks
Due to the critical LAD stenosis, these patients usually require invasive therapy, do poorly with medical management, and may suffer MI or cardiac arrest if inappropriately stress tested
Deeply inverted or biphasic T waves in V2-3 (may extend to V1-6)
ECG pattern present in pain-free state
Isoelectric or minimally-elevated ST segment (< 1mm)
No precordial Q waves
Preserved precordial R wave progression
Recent history of angina
Normal or slightly elevated serum cardiac markers
There are two patterns of T-wave abnormality in Wellens syndrome:
Type A – Biphasic, with initial positivity and terminal negativity (25% of cases)
Type B – Deeply and symmetrically inverted (75% of cases)
Biphasic T Waves (Type A)
Wellens Pattern A (Type 1)
Wellens Pattern A (Type 1)
Deeply Inverted T Waves (Type B)
Wellens Pattern B (Type 2)
Wellens Pattern B (Type 2)
Wellens T wave evolution
T wave changes can evolve over time from Type A to Type B pattern (Smith et al).
Evolution of T-wave inversion [A-D] after coronary reperfusion in STEMI reperfusion and in Wellens syndrome (NSTEMI). Modified from Smith et al. Evolution of T-wave inversion. The ECG in acute MI, 2002
Understanding T wave changes
The following sequence of events is thought to occur in patients with Wellens syndrome:
A sudden complete occlusion of the LAD causes a transient anterior STEMI, causing chest pain & diaphoresis. This stage may not be successfully captured on an ECG recording
Re-perfusion of the LAD (e.g. due to spontaneous clot lysis or prehospital aspirin) leads to resolution of chest pain. ST elevation improves and T waves become biphasic or inverted. The T wave morphology is identical to patients who reperfuse after a successful PCI
If the artery remains open, the T waves evolve over time from biphasic to deeply inverted
The coronary perfusion is unstable, however, and the LAD can re-occlude at any time. If this happens, the first sign on the ECG is an apparent normalisation of the T waves — so-called “pseudo-normalisation”. The T waves switch from biphasic/inverted to upright and prominent. This is a sign of hyperacute STEMI and is usually accompanied by recurrence of chest pain, although the ECG changes can precede the symptoms
If the artery remains occluded, the patient now develops an evolving anterior STEMI
Alternatively, a “stuttering” pattern may develop, with intermittent reperfusion and re-occlusion. This would manifest as alternating ECGs demonstrating Wellens and pseudonormalisation/STEMI patterns
This sequence of events is not limited to the anterior leads — similar changes may be seen in the inferior or lateral leads, e.g. with RCA or circumflex occlusion.
Also, the inciting event does not necessarily have to be thrombus formation — Wellens syndrome may also occur in normal coronary arteries following an episode of vasospasm, as in this case of cocaine-induced vasospasm. However, it is safer to assume the worst (i.e. critical LAD stenosis) and work the patient up for an angiogram.
The concept of occlusion/reperfusion/re-occlusion is explained by Dr Stephen Smith. Also check out Example 5, below.
History of Wellens Syndrome
1979 – Gerson et al first described the occurrence of exercise-induced U wave inversion (inverted terminal T-waves) in the precordial leads in patients with proximal left anterior descending artery (LAD) ischemia. 33/36 patients (92%) with this abnormality had >75% stenosis in the proximal LAD.
1980 – Gerson further evaluated ‘U-wave inversion‘, this time at rest, and found 24/27 (89%) of patients with the ECG findings had evidence of LAD or left main ischemia.
1982 – De Zwaan, Wellens et al reported a similar ECG abnormality without mentioning inverted U-waves. They observed that patients admitted for unstable angina with this ECG finding were at high risk for myocardial infarction.
Semantic nomenclature
There is confusion in the literature regarding the naming of the T wave patterns, with some authors using Type 1 (Type A) for biphasic T waves and Type 2 (Type B) for inverted. It may be better to just describe the T wave pattern!
Original description**
ECG patterns in precordial leads of the patients reported. Pattern A was found in four patients; pattern B, in 22 patients
Biphasic precordial T waves with terminal negativity, most prominent in V2-3
Minor precordial ST elevation
Preserved R wave progression (R wave in V3 > 3mm)
Example 2
Wellens Syndrome (Type A Pattern)
The biphasic T waves in V2-3 are characteristic of Wellens syndrome
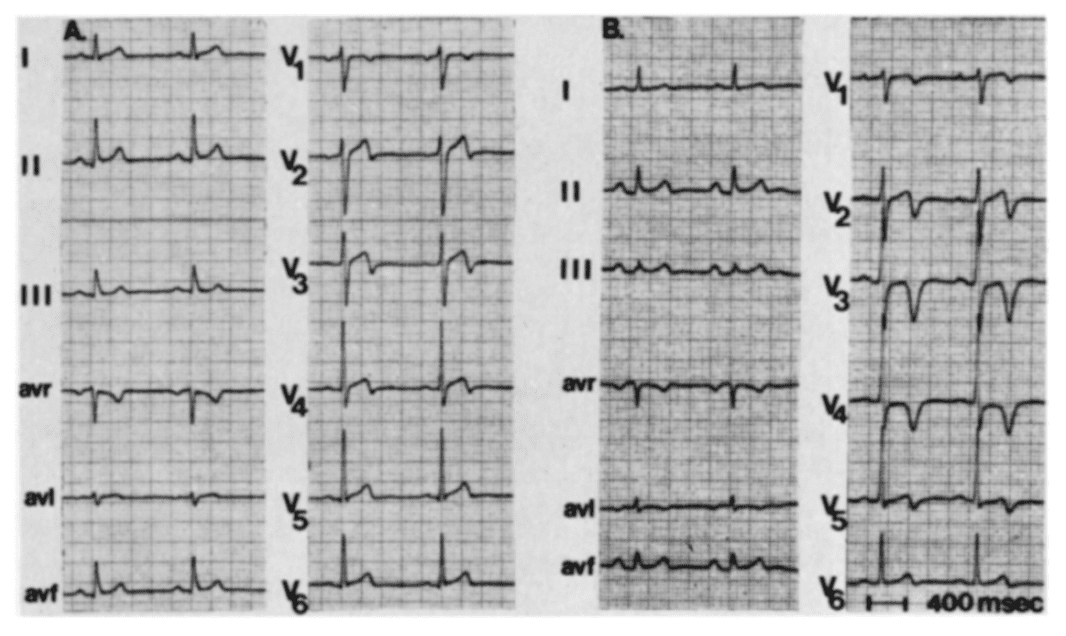
Example 3
Wellens Syndrome (Type B Pattern)
There are deep, symmetrical T wave inversions throughout the anterolateral leads (V1-6, I, aVL)
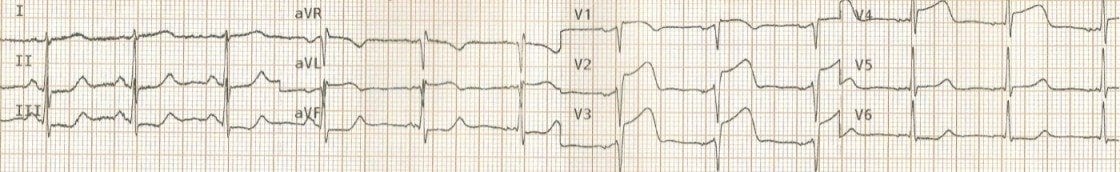
Example 4
Wellens Syndrome (Type A Pattern)
Biphasic T waves with minimal ST elevation in V1-5, consistent with Wellens syndrome
The patient had experienced ischaemic chest pain immediately prior to arrival in hospital and was pain free at the time the ECG was taken
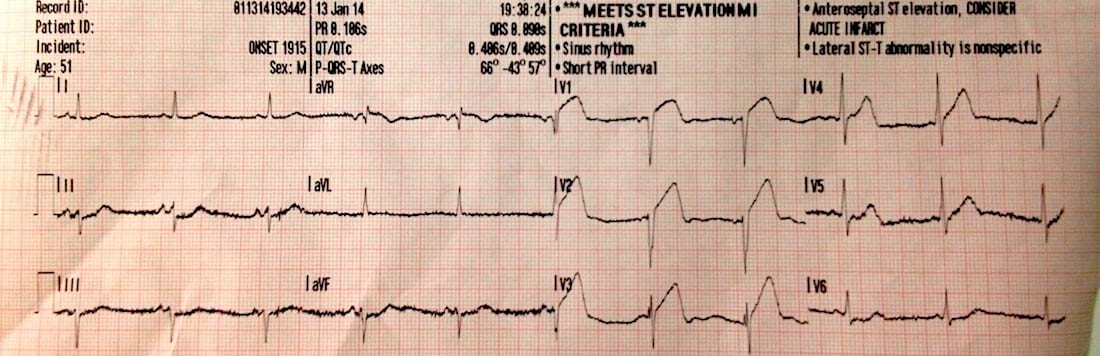
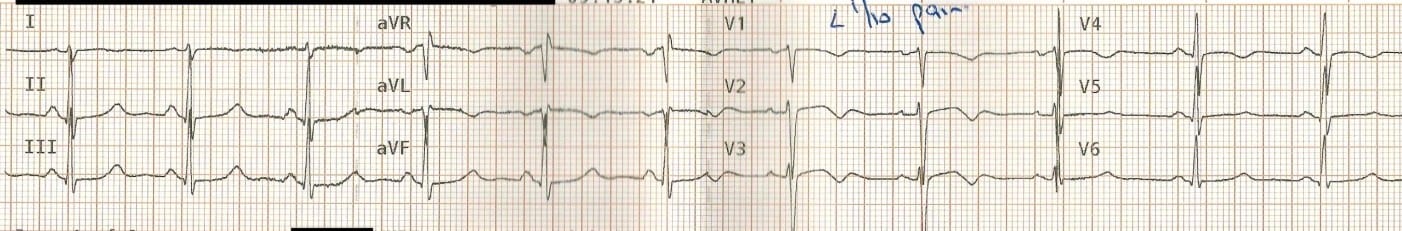
The prehospital ECG from ~15 minutes earlier demonstrates a clear anterolateral STEMI:
This prehospital ECG was taken while the patient was still symptomatic with chest pain and diaphoresis
It shows unmistakable features of anterolateral STEMI, with marked precordial ST elevations and inferior reciprocal change
The symptom resolution and conversion to a Wellens ECG on arrival to hospital indicates reperfusion of the LAD
Example 5
This fantastic ECG series (submitted by paramedic Andrew Bishop) shows a stuttering pattern of LAD occlusion, reperfusion and re-occlusion in a middle aged lady with chest pain.
The ECGs are presented in chronological order, over a 45 minute period from the prehospital environment to the cath lab:
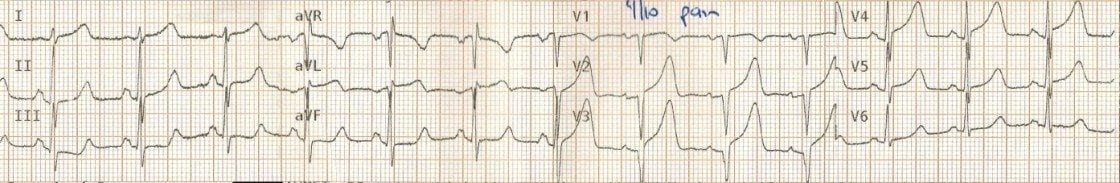
(a) Patient experiencing chest pain and diaphoresis
The ECG now shows a typical Wellens pattern of biphasic T waves in V2-3, plus improvement in the anterolateral ST elevation
This indicates spontaneous reperfusion of the LAD — i.e. the artery has re-opened
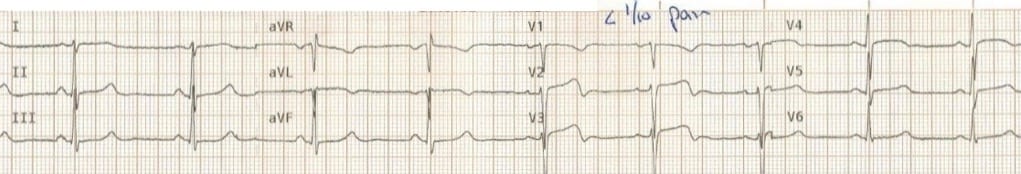
(c) Recurrence of chest pain and diaphoresis
With recurrence of pain there is pseudo-normalisation of the precordial T waves: the previously biphasic T waves have become prominently upright (= “hyperacute” T waves)
This apparent normalisation of the T waves indicates re-occlusion of the LAD artery
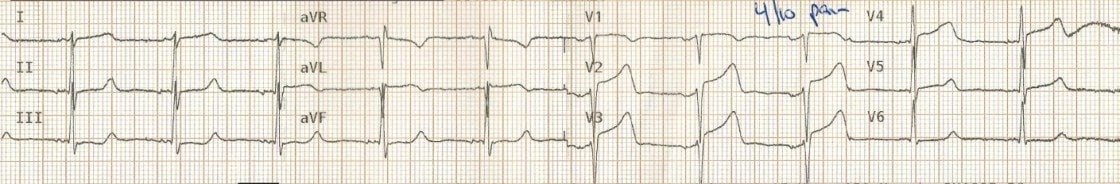
(d) Ongoing ischaemic symptoms
Following re-occlusion of the artery, there is further evolution of the anterolateral ST changes, with evolving anterior STEMI
(e) Symptoms improving
Once again there is reperfusion of the artery, only this time the ST changes are slower to resolve
(f) Now Pain Free
Now the T waves are starting to become biphasic again (Wellens Pattern A)
Shortly after this series of ECGs was taken, this patient suffered a VF arrest that was refractory to defibrillation. She was placed on a mechanical CPR device and taken to the cath lab, where she was found to have a 100% proximal LAD stenosis. This was stented, she was successfully cardioverted and subsequently made a good neurological recovery!
Differential Diagnosis of Wellens Syndrome
While the morphology of the T wave changes in Wellens syndrome is often quite distinctive, there are numerous other conditions that may produce similar patterns of precordial T-wave inversion, including:
Explore the links above to appreciate the similarities and differences between these ECG patterns.
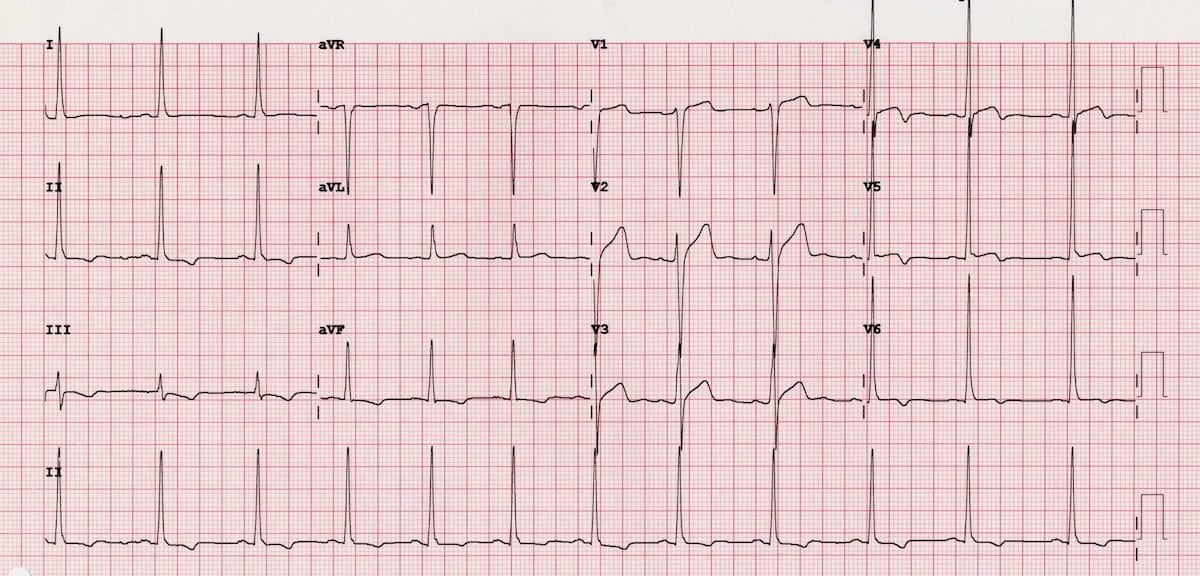
But is this Wellens?
This ECG was initially posted as an example of Wellens syndrome. What do you make of it?
Reveal Answer
Whilst T-wave inversion in V2-3 here may appear to represent Wellens syndrome, the presence of associated T-wave inversion in V1 and lead III is highly specific for the diagnosis of pulmonary embolism.
When right precordial T-wave inversion is present, the clinician should be prompted to look for other ECG features suggestive of RV dilatation, including clockwise rotation and right axis deviation.
Other features suggestive of PE here include:
Tachycardia (~100bpm)
Rightward axis (+90)
Clockwise rotation — there is a shift of the R/S transition point to V5-6. Read this case example for a more detailed explanation of clockwise rotation
The pattern of inverted and biphasic T waves is different to Wellens syndrome, affecting multiple leads (i.e. any lead with a tall R wave) rather than V2-3
In this case, the Wellens-like T waves are just a variant on the repolarisation abnormality (LV “strain”pattern) that is seen with LVH
This pattern of T wave changes:
Is most commonly seen in the lateral leads (V5-6, I, aVL)
Typically occurs in patients with high QRS voltages, e.g. due to LVH, or in young black males with benign early repolarization

![Evolution of T-wave inversion [A-D] after coronary reperfusion in STEMI reperfusion and in Wellens syndrome (NSTEMI)](https://litfl.com/wp-content/uploads/2018/08/Evolution-of-T-wave-inversion-A-D-after-coronary-reperfusion-in-STEMI-reperfusion-and-in-Wellens-syndrome-NSTEMI.png)


No comments:
Post a Comment